
 LinkBack URL
 About LinkBacks
File size: 61.2 MB
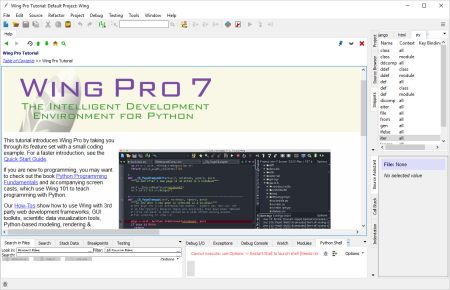
Wing IDE Professional is a full-featured Python IDE designed for professional programmers.
It includes powerful editor, code intelligence, refactoring, debugging, search, unit testing, project management, and revision control features. The Wing IDE layout is straightforward, with the editor window being its central fixture. Supporting panes, source browser, run output and debug panes and so on, are arranged on the periphery. In the lower right is the ently useful Source Assistant pane, the Wing IDE's answer to call tips. B typing, say, a function call, and the prototype and docstrings information for the corresponding functions are displayed in the Source Assistant. Continue typing, and the likely matches are appropriately reduced. Also, when you click a function name anywhere in the editor (whether at a definition point or a reference point), the function's information is displayed in the Source Assistant. If you select a method, and that method has overridden a parent class method, the Source Assistant displays a clickable link for the location of the overridden method.
Wingware's debugger is highly configurable. For example, you can set the debugger to stop when an exception is raised, but before the except or finally clauses have run; or you can configure the debugger to let those clauses run and then halt execution. Also, you can configure the debugger's watch system to display an object's content only when that object is in context, or hold a reference to the object and show its contents regardless of the current context.
The debugger can handle multithreaded applications, when debugging the target application is halted by, say, a breakpoint, by default the debugger stops all threads and indicates which thread caused the suspension. However, this is configurable so that, if one thread hits a breakpoint, the others can continue to run.
GUI, Web, and script debugging
Exception traceback reporting
View stack, locals/globals, and return value
Supports input and raw_input
Integrated debug process I/O with configurable text encoding
Native console I/O
Multi-threaded debugging
Remote debugging
Debug value tooltips
Detect unhandled exceptions
Works with Django, web2py, Flask, Google App Ee, Plone, Turbogears, Zope and Plone
Alter debug data values
Multiple named entry points and debug launch configurations
Interactive debug probe with auto-completion, syntax highlighting, goto-definition, call tips, and documentation links
Convenient Restart Debugging tool
Track values by reference
Evaluate expressions
Conditional breakpoints
Ignore-counted breakpoints
Enable/disable breakpoints
Move debug program counter
Multi-process and automatic child process debugging
Debugs unit tests
Breakpoint manager
Process attach/detach
Inspect sys.modules
Debug Django template files
matplotlib mainloop support
Mark a range of code in the editor for quick reevaluation in Python Shell or Debug Probe
DOWNLOAD
uploadgig
rapidgatorKod:https://uploadgig.com/file/download/f7073a5334a9dFE8/4NJeKxHW_Wing_Pro_7.rar
nitroflareKod:https://rapidgator.net/file/e463d694fb0ec21559ea21666a48870b/4NJeKxHW_Wing_Pro_7.rar
Kod:http://nitroflare.com/view/B8E13E88A74742A/4NJeKxHW_Wing_Pro_7.rar

1 sonuçtan 1 ile 1 arası
Konu: Wing Pro 7.2.1.0
-
30.01.2020 #1Üye


")
- Üyelik tarihi
- 17.12.2018
- Mesajlar
- 28.592
- Konular
- 0
- Bölümü
- Gıda
- Cinsiyet
- Erkek
- Tecrübe Puanı
- 35
Wing Pro 7.2.1.0


 Alıntı
Konu Bilgileri
Users Browsing this Thread
Şu an 1 kullanıcı var. (0 üye ve 1 konuk)

Konuyu Favori Sayfanıza Ekleyin