
 LinkBack URL
 About LinkBacks
File Size: 104.6 MB
If you are a student, physics, eeer or scientist and you are dealing with complicated numerical mathematics or a lot of measuring data, then SimplexNumerica is the powerful, intuitive software for analysing and presenting your solution.
SimplexNumerica enhanced all your needs and helps you to evaluate and visualize your data. The GUI you are met with is a bit overwhelming, seeing it encloses a menu bar, many buttons, a few panes to display various useful information and some tabs so that you can multi-task with ease. Nevertheless, you should know that comprehensive and well-drawn Help contents are provided on the developer's website, which might aid bners in finding their way around SimplexNumerica.
Multiple examples at your fingertips and many supported extensions
First and foremost, you should know that this program comes packed with a pretty large number of sample scripts and examples for many of its options, including function plots, graph plots, math functions, histograms and IIR filters. These enable you to learn how to get around the tool much faster.
It provides a powerful Microsoft Office 2016 like computing environment for eeering and scientific applications.
It centralized your data and algorithms.
It includes hundreds of mathematical functions.
It has a high level C++ programming language (AngelScript) which allows access to advanced data structures, 2-D and 3-D graphical functions.
It includes a large number of algorithm.
It imports measured data in all popular formats.
It has enhanced database import.
Simply use the Microsoft Excel Import / Export.
It can use analyses automatically on any number of measurements.
You can share your (encrypted) evaluations or templates with other users over the internet or internal LAN (your intranet).
Multiple chart types can be combined using layers.
Cursor Functions
You can evaluate your data interactively with the powerful cursor tools as you can see on the left picture. You can see immediately what you have measured and extract key information from your data without having to make calculations. In addition you can use the inbuilt statistic window with all the common standard statictics necessary for your evaluation.
Database Import
Is it possible to import from my database straight away into the coordinate systems, charts and shapes without a detour as in some other programs?
Yes, you can import data directly from a Client database like Microsoft Access or a Server database like Microsoft SQL Server or Oracle direct into SimplexNumerica (with the help of a comfortable inbuilt wizard).
The picture to the right shows a report that was generated immediately from a SQL Server database. You can also trending data and refreshing database data in all available charts.
Microsoft Excel Import / Export
Like Excel, the inbuilt spreadsheet in SimplexNumerica can perform formula-based calculations and many other mathematical functions. It has inbuilt algorithm (like FFT) that can be used directly in the spreadsheet, too. The results can be saved (exported) in an Excel file (*.xls or *.xlsx).
You can also import your data directly from an Excel file (*.xls or *.xlsx) into a similar SimplexNumerica spreadsheet. The Import Wizard examines the Excel file (or text file, like *.CSV) that you are importing and helps you ensure that the data is imported in the way that you want.
Inbuilt Scripting Ee (angelscript)
The inbuilt scripting languages of SimplexNumerica is based on AngelScript. AngelScript is a scripting library designed to allow applications to extend their functionality through internal and with the help of SimplexIPC to external scripts.
AngelScript is a scripting language with a syntax that's very similar to C++. It is a strictly typed language with many of the types being the same as in C++. Please have a look to the documentation. It will explain some concepts of how to use AngelScript in general, but a basic knowledge of the language will be needed to understand all of the concepts.
Combined Charts
In SimplexNumerica, we always can create charts comparing different types of data. There are several chart types we can use, such as column, bar, line, pie, scatter chart and so on.
Somes it's necessary to plot two or more sets of values to show multiple types of data, such as a column chart and a line graph. In this case, you can create a combination chart which is to combine two different charts to make one.
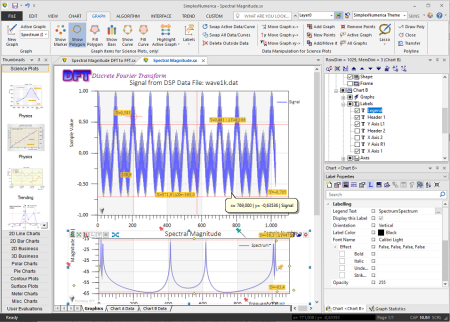
Fast Fourier Transform (FFT)
A fast Fourier transform is an algorithm that samples a signal over a period of and divides it into its frequency components. These components are single sinusoidal oscillations at distinct frequencies each with their own amplitude and phase. {Wikipedia}
SimplexNumerica provides Signal Processing incl. FFT in a wide ranges of functionality. You can calc and draw all the informations you need with the help of the Ribbonbar Algorithm and the assosiated properties.
Digital Dashboard
Dashboards are an easy-to-digest view of an organization's key performance indicators (KPI) that lets viewers spot decisions and act on opportunities quickly. So, while we like to look good, a dashboard that fails to communicate key messages in your business data is a waste of , money and effort.
With SimplexNumerica it's really easy to place charts and shapes on a layered page. You can try a bulk of selection of dashboards with overview and detail views so that you can quickly review this and then look deeper only if you wish. If you create an overview, make sure you have everything that a manager needs to know to make decisions on this dashboard. If a crucial metric is only in a detailed view, it is likely to be overlooked.
official site does not provide any info about changes in this version.
DOWNLOAD
uploadgig
rapidgatorKod:https://uploadgig.com/file/download/d317430f6b6b2864/6o2os6Q4_SimplexNume.rar
nitroflareKod:https://rapidgator.net/file/9f2ea69f9d33641fcc9c8de109604a0d/6o2os6Q4_SimplexNume.rar
Kod:http://nitroflare.com/view/66F4EA689867144/6o2os6Q4_SimplexNume.rar

1 sonuçtan 1 ile 1 arası
Hybrid View
-
10.02.2020 #1Üye


")
- Üyelik tarihi
- 17.12.2018
- Mesajlar
- 28.592
- Konular
- 0
- Bölümü
- Gıda
- Cinsiyet
- Erkek
- Tecrübe Puanı
- 35
SimplexNumerica 16.1.22.2 (x64)


 Alıntı
Konu Bilgileri
Users Browsing this Thread
Şu an 1 kullanıcı var. (0 üye ve 1 konuk)

Konuyu Favori Sayfanıza Ekleyin