
 LinkBack URL
 About LinkBacks
Create Executive Dashboards with SQL Server Report Builder
MP4 | Video: AVC 1280x720 | Audio: AAC 44KHz 2ch | Duration: 2.5 Hours | Lec: 23 | 263 MB
Genre: eLearning | Language: English
Learn how to create executive dashboards used by top executives to make important business decisions
A digital dashboard, also known as an enterprise dashboard or executive dashboard, is a business management tool used to visually ascertain the status (or "health") of a business enterprise via key business indicators. Digital dashboards use visual, at-a-glance displays of data pulled from disparate business systems to provide warnings, action notices, next steps, and summaries of business conditions.
Dashboards are visual representation of the data already collected and stored on your database. They through visualization convert Data into meaningful information that you can act upon.
Data is one of the most valuable assets owned by your business. Converting this data to meaningful information will help executive teams make important decisions.
A well designed visual dashboard has the ability to inform business executives across the organization hierarchies and provide on-demand access to core business metrics. These dishoards can be viewed on your desktop and mobile devices.
In today's environment data is everywhere - sales, marketing, social, paid media, owned media, IT operations, HR and others. Managing and extracting real value from all that data is a key challenge facing executives at all levels in organization starting from an analyst at lowest rung of business hierarchy , managers and CXOs. In seeking a way to simplify data analysis and distribution, executives (across all business hierarchy) often find themselves quickly dealing with data and information overload.
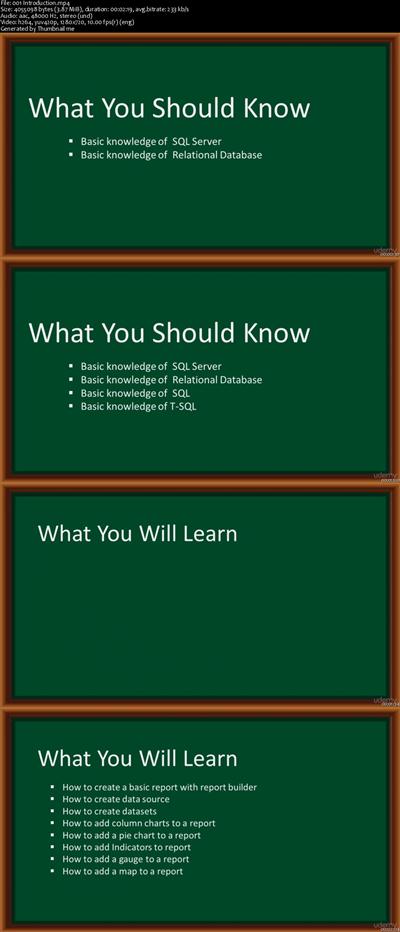
Discover how to create and manage interactive reports using SQL Server Reporting Services (SSRS) and SQL Server Report builder. You will build and format reports from a variety of data sources. You will create datasets and build various types of reports .
Topics include:
Creating a column chart
Creating a Pie chart
Adding Indicators to reports
Adding Gauge to reports
Adding Maps to Reports
After completing this course you will be confident to create your own dashboards.
Download link:
uploadgig_com:
[Misafirler Kayıt Olmadan Link Göremezler Lütfen Kayıt İçin Tıklayın ! ]
uploaded_net:
[Misafirler Kayıt Olmadan Link Göremezler Lütfen Kayıt İçin Tıklayın ! ]Links are Interchangeable - No Password - Single Extraction

1 sonuçtan 1 ile 1 arası
Threaded View
-
13.06.2017 #1Üye


")
- Üyelik tarihi
- 20.08.2016
- Mesajlar
- 151.019
- Konular
- 0
- Bölümü
- Bilgisayar
- Cinsiyet
- Kadın
- Tecrübe Puanı
- 161
Create Executive Dashboards.with SQL Server Report Builder


 Alıntı
Konu Bilgileri
Users Browsing this Thread
Şu an 1 kullanıcı var. (0 üye ve 1 konuk)

Konuyu Favori Sayfanıza Ekleyin