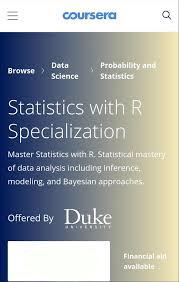
Coursera - Statistics with R Specialization by Duke University
Video: .mp4 (1280x720) | Audio: AAC, 44100 kHz, 2ch | Size: 3.03 Gb | Materials: PDF
Genre: eLearning Video | Duration: 15h 47m | Language: English
Master Statistics with R. Statistical mastery of data analysis including inference, modeling, and Bayesian approaches.
Introduction to Probability and Data
This course introduces you to sampling and exploring data, as well as basic probability theory and Bayes' rule. You will examine various types of sampling methods, and discuss how such methods can impact the scope of inference. A variety of exploratory data analysis techniques will be covered, including numeric summary statistics and basic data visualization. You will be guided through installing and using R and RStudio (free statistical software), and will use this software for lab exercises and a final project. The concepts and techniques in this course will serve as building blocks for the inference and modeling courses in the Specialization.
Inferential Statistics
This course covers commonly used statistical inference methods for numerical and categorical data. You will learn how to set up and perform hypothesis tests, interpret p-values, and report the results of your analysis in a way that is interpretable for clients or the public. Using numerous data examples, you will learn to report estimates of quantities in a way that expresses the uncertainty of the quantity of interest. You will be guided through installing and using R and RStudio (free statistical software), and will use this software for lab exercises and a final project. The course introduces practical tools for performing data analysis and explores the fundamental concepts necessary to interpret and report results for both categorical and numerical data
Linear Regression and Modeling
This course introduces simple and multiple linear regression models. These models allow you to assess the relationship between variables in a data set and a continuous response variable. Is there a relationship between the physical attractiveness of a professor and their student evaluation scores? Can we predict the test score for a child based on certain characteristics of his or her mother? In this course, you will learn the fundamental theory behind linear regression and, through data examples, learn to fit, examine, and utilize regression models to examine relationships between multiple variables, using the free statistical software R and RStudio.
Bayesian Statistics
This course describes Bayesian statistics, in which one's inferences about parameters or hypotheses are updated as evidence accumulates. You will learn to use Bayes' rule to transform prior probabilities into posterior probabilities, and be introduced to the underlying theory and perspective of the Bayesian paradigm. The course will apply Bayesian methods to several practical problems, to show end-to-end Bayesian analyses that move from framing the question to building models to eliciting prior probabilities to implementing in R (free statistical software) the final posterior distribution. Additionally, the course will introduce credible regions, Bayesian comparisons of means and proportions, Bayesian regression and inference using multiple models, and discussion of Bayesian prediction.
We assume learners in this course have background knowledge equivalent to what is covered in the earlier three courses in this specialization: "Introduction to Probability and Data," "Inferential Statistics," and "Linear Regression and Modeling."
Statistics with R Capstone
The capstone project will be an analysis using R that answers a specific scientific/business question provided by the course team. A large and complex dataset will be provided to learners and the analysis will require the application of a variety of methods and techniques introduced in the previous courses, including exploratory data analysis through data visualization and numerical summaries, statistical inference, and modeling as well as interpretations of these results in the context of the data and the research question. The analysis will implement both frequentist and Bayesian techniques and discuss in context of the data how these two approaches are similar and different, and what these differences mean for conclusions that can be drawn from the data.
A sampling of the final projects will be featured on the Duke Statistical Science department website. Note: Only learners who have passed the four previous courses in the specialization are eligible to take the Capstone.
Download link:Kod:rapidgator_net: https://rapidgator.net/file/bb8924e7157b164af7d1bbc604b72f4b/sb0qt.Coursera..Statistics.with.R.Specialization.by.Duke.University.part1.rar.html https://rapidgator.net/file/56773d73903c99d66328b61573cad3f0/sb0qt.Coursera..Statistics.with.R.Specialization.by.Duke.University.part2.rar.html https://rapidgator.net/file/aa3c2609170ecdb82891943717b68e49/sb0qt.Coursera..Statistics.with.R.Specialization.by.Duke.University.part3.rar.html https://rapidgator.net/file/d684c3cf11f14774bb07154f6339d14b/sb0qt.Coursera..Statistics.with.R.Specialization.by.Duke.University.part4.rar.html nitroflare_com: https://nitroflare.com/view/81B96A4A49EA0D4/sb0qt.Coursera..Statistics.with.R.Specialization.by.Duke.University.part1.rar https://nitroflare.com/view/A727C5BC68EA0CF/sb0qt.Coursera..Statistics.with.R.Specialization.by.Duke.University.part2.rar https://nitroflare.com/view/434C477750AD694/sb0qt.Coursera..Statistics.with.R.Specialization.by.Duke.University.part3.rar https://nitroflare.com/view/990EF65FAAC2520/sb0qt.Coursera..Statistics.with.R.Specialization.by.Duke.University.part4.rarLinks are Interchangeable - No Password - Single Extraction
1 sonuçtan 1 ile 1 arası
Threaded View
-
27.04.2020 #1Üye


- Üyelik tarihi
- 20.08.2016
- Mesajlar
- 150.962
- Konular
- 0
- Bölümü
- Bilgisayar
- Cinsiyet
- Kadın
- Tecrübe Puanı
- 160
Coursera - Statistics with R Specialization by Duke University
Konu Bilgileri
Users Browsing this Thread
Şu an 1 kullanıcı var. (0 üye ve 1 konuk)


 LinkBack URL
 About LinkBacks


 Alıntı
Konuyu Favori Sayfanıza Ekleyin